Sharp IR Rangefinders and Arduino: Make your Robot Smarter
Adding distance or proximity sensors to your robot is a great way to start exploring your environment intelligently. Rangefinders allow a non-contact method of “seeing” obstacles and can be employed in mapping and maze solving as well.
The Sharp family of infrared (IR) rangefinders is very popular amongst hobby roboticists because they are low-cost and easy to interface with (Voltage, Ground, and Signal). These hook up to a single analog input pin on the Arduino or similar microcontroller systems. There are a few caveats to watch out for though.
If your application is very time sensitive and needs tightly controlled, you’ll want to find out how long polling your sensor(s) takes. The Sharp sensors output an analog value (as a voltage), but microcontrollers only understand digital values (1 or 0), so that analog value has to be converted. Analog to digital conversion is pretty fast, but it can introduce some delays.
The sensors are also very noisy, meaning the analog output signal has a lot of "jitter" -- 20cm does not always equal 280, etc. Your code will have to account for this jitter, so you'll need to collect some real-world values to build your sensor model. This problem is exacerbated by the next issue, but can be overcome with a little bit of thought and time. I don't provide you the solution here because it's really dependent on your application. There is, however, a tool to help you evaluate your sensors (see below).
Moving on, take a look at this graph:
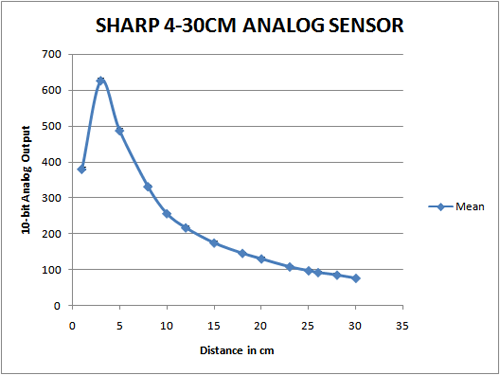
You’ll notice something interesting here – the graph has a weird curve and isn’t linear at all. This becomes tricky when trying to teach the robot to understand distance from the analog output of the sensor.
There are a few ways to get around this. If all you want is a simple threshold say “nothing closer than 20cm” then you can simply run a few tests with an object placed 20cm away from the sensor, and then hardcode that value into your program. Generally it’s a bit more complicated, if you want the program to understand varying distance.
Method 1:
Approach: Find a best-fit curve (generally exponential or polynomial) using a statistics package (Excel, R, Minitab)
Pros: Easy to implement, gets you started fast.
Cons: Requires floating point math, which isn’t natively supported by most microcontrollers. You can still use floating point, but it’s slow and inefficient in most cases.
Method 2:
Approach: Gather some data points and create a look up table of values. Your code will linearly interpolate values between each data point (ie, 5cm=600, 10cm=300, etc).
Pros: Uses integer math which is fast and efficient
Cons: Takes up more memory and doesn’t give exact values
Method 2 is the preferred approach as most embedded system developers take great pains to avoid floating point math. You can have some floating point math on the Arduino and be alright. I have a large (6KB) program right now that has floating point littered all over the place (it’s necessary for this code) and execution time runs just fine.
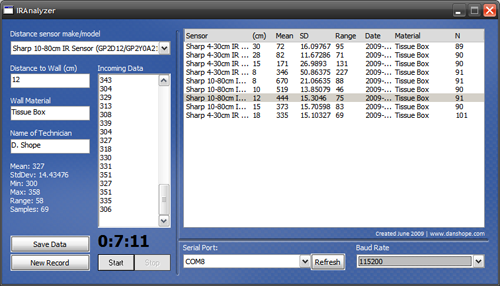
To help with gathering your data for both method 2 and simple thresholding I wrote a quick little application that interfaces with the Arduino’s serial connection. This app will pull your data in and calculate some basic statistics such as standard deviation, mean average, and range of values. You can store the data for future computation and reference.
Download the IRanalzyer at http://www.danshope.com/calton/ir.html
To use the IRanalyzer you need to send values from the Arduino. Here’s a sample sketch to get you started:
#define SerialSpeed 115200 //typical values are 9600 or 115200
#define SampFrequency 10 //sampling frequency in Hz (cycles per second)
#define AnalogPIN 0 //define your pin here

int mDelay;

void setup()
{
Serial.begin(SerialSpeed);
mDelay = 1000/SampFrequency; //calculate delay for proper sampling rate
}

void loop()
{
delay(mDelay); //delay in milliseconds
Serial.println( analogRead(AnalogPIN) ); //reads the analog port and prints value over serial
}
Labels: arduino, cmu robotics club, code, download, free, guide, infrared, ir, rangefinders, robot, sharp, software, tool
This entry was posted
on Wednesday, June 24, 2009 at 2:00 AM.
![]()
 Subscribe to DanShope.com